Residential Property Insurance in California: A Tale of Two Markets
By Carolyn Kousky and Xuesong You
Overview
The California residential property insurance market has been under stress recently due to a combination of growing wildfire risk, prior regulatory restrictions, and recent macroeconomic challenges since the pandemic. While often portrayed as a state-wide crisis, the insurance dislocation has been largely limited to the highest risk areas of the state, with the rest of the market remaining healthy. In this post, we unpack recent trends in the state’s residential property insurance market.
Fire Risk in California and the Implications for Insurability
Before the recent LA conflagrations, the most damaging wildfires in California’s history had been the 2017 and 2018 wildfire seasons. These two seasons were responsible for three of the most costly and damaging wildland fires in U.S. history: the 2017 Tubbs Fire, the 2018 Camp Fire, and the 2018 Woolsey Fire. Total insured losses exceed $20 billion. This amount exceeded cumulative underwriting profits for the state’s homeowners insurance industry from the prior quarter century twice over (even after adjusting for subrogation). This magnitude of losses led to a reassessment of risk across the industry in a state with regulatory constraints limiting the ability to incorporate necessary rate changes.
Accordingly, the following years saw a pronounced deterioration in insurance availability within the admitted market in high fire-risk regions, a growing reliance on the residual market, and rising insurance costs for households. As we will see, however, these markets concentrated in the high wildfire-risk areas of the state.
In all subsequent analyses in this post, we examine various market impacts across quintiles of wildfire risk across California. As our measure of wildfire risk, we use the property wildfire risk scores used by insurers and based off commercial models. These scores are collected by the California Department of Insurance in their wildfire risk report. Using this metric, we group California zip codes into five quintiles of risk based on the average fire score of properties in that zip code. This is shown in Figure 1.
Note that while fewer than 5% of residential structures are located in very high-fire-risk ZIP codes, these areas accounted for over 69% of insured losses from catastrophic fires recorded between 2018 and 2023 [1]. A small share of homes is thus responsible for the majority of insured losses.
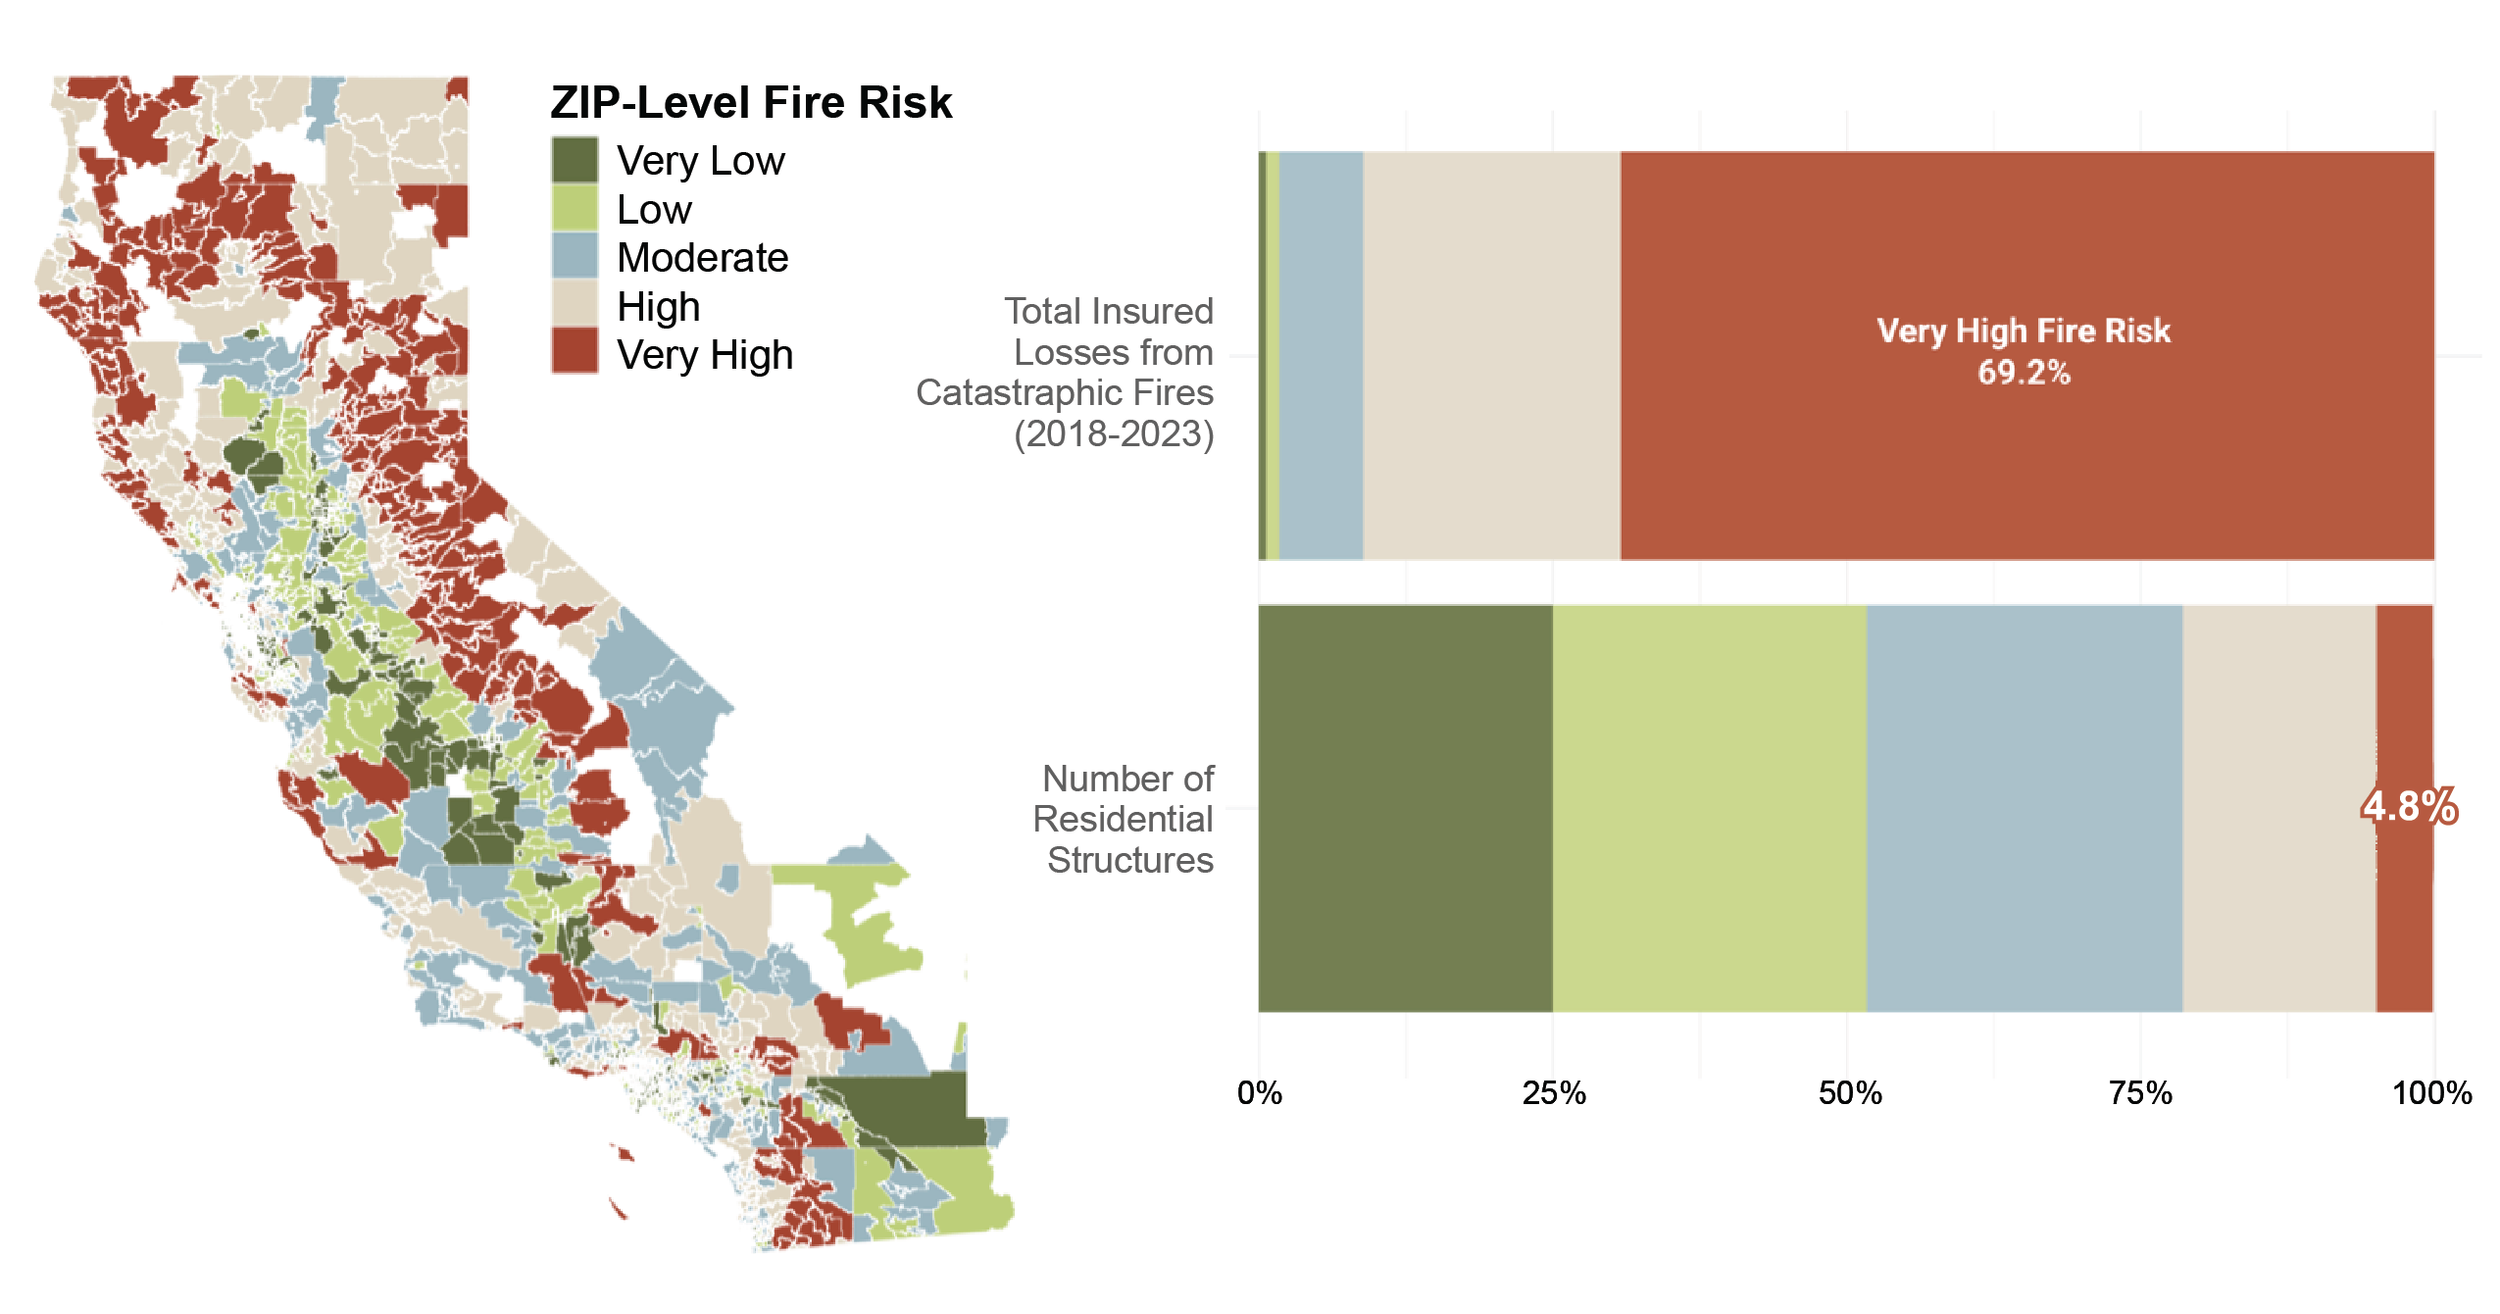
Figure 1: Distribution of Residential Structures and Insured Losses from 2018–2023 Catastrophic Wildfires by ZIP-Level Fire Risk
Note: Sample includes homeowner, mobile home, and dwelling-fire policies. Policies for renters and condominium unit owners are excluded. Measure of wildfire risk is based on the average fire risk scores at the ZIP code level from CDI’s Wildfire Risk Report, measured as of the 2018 estimates.
Source: ZIP-code level fire risk and insured catastrophic fire losses from the California Department of Insurance’s Wildfire Risk Information Report. Residential structure data from the National Structure Inventory.
A Tale of Two Markets
The concentration of wildfire risk in a small number of zip codes is the key to understanding the state of California’s insurance market and, more importantly, why a statewide narrative of “crisis” fails to capture important nuances that should be inform any further policy interventions.
When compared to national metrics for market health, California's admitted market appears financially robust. Statewide, as of 2026, the vast majority (94%) of residential property insurance policies remain covered by the admitted market [2]. In 2025, the latest year for which we have data for insurer financial performance [3] almost a quarter of private insurers providing homeowners coverage in the state were large carriers with assets over $3 billion. Additionally, 88% of the firms operated in other states, 95% were subsidiaries of larger insurance groups, and over 70% had an AM Best Financial Strength Rating of A or above. On each of these measures, California exceeds national averages. This means most firms in the state are well diversified across the country and across perils and have strong financial capacity to absorb large losses in California. As an indication of this, a year after the globally record-setting LA fires, there have been no insurer insolvencies.
However, these statewide statistics mask considerable heterogeneity within the state. The market in high-risk areas of California looks quite different from the market overall, particularly for homeowners policies. In the sections that follow, we will illustrate how this divergence plays out across three dimensions: the availability of admitted market coverage, reliance on the state’s FAIR Plan, and market concentration. In each case, we observe a consistent pattern demonstrating a tale of two markets: insurance conditions in the high-risk zip codes have deteriorated sharply, while the rest of the state has remained stable or even improved.
Declining Availability of Coverage
Following the 2017 and 2018 fires, non-renewals (when an insurer does not renew a policy for another term) increased, with this effect most pronounced in very high-risk areas. This was coupled, however, with insurers also stopping writing new business in high-risk areas such that between 2009 and 2024, there was an over 40% decline in admitted market residential insurance policies in the high-risk zip codes of California[4]. This is shown in Figure 2. By contrast, however, in the very low, low, and moderate risk zip codes of the state, there was actually an increase in admitted market coverage. While some households in lower-risk areas may still struggle with insurability, it makes clear that the crisis of availability of insurance is very localized in the state to the highest risk areas.
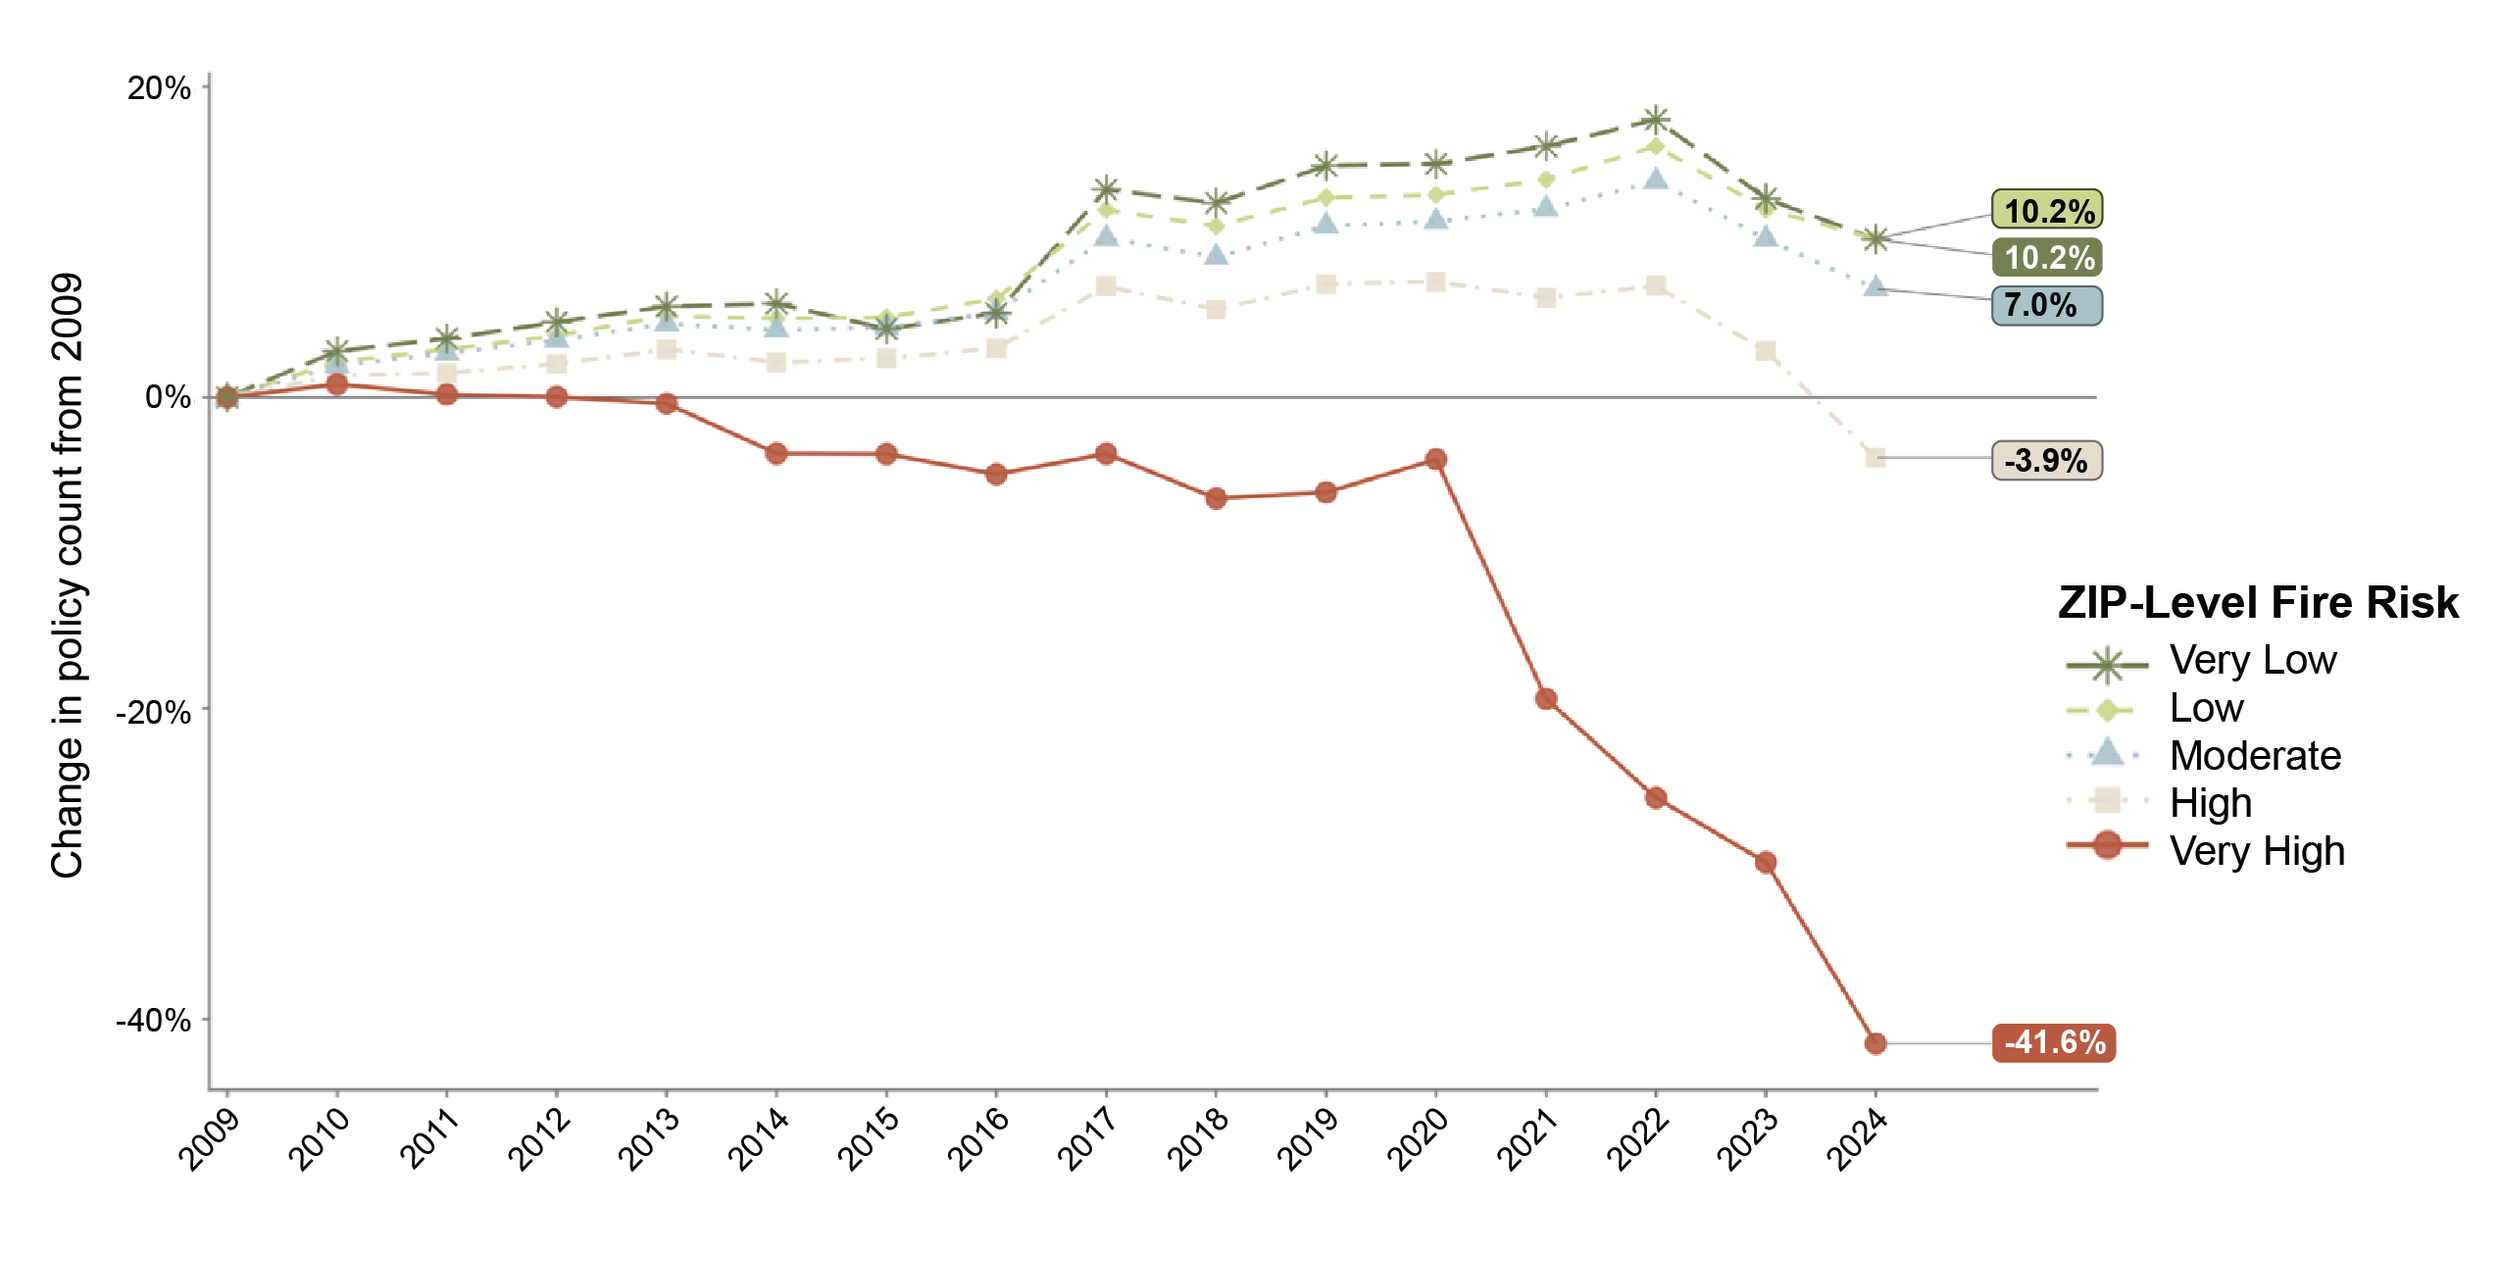
Figure 2: Change in Admitted Market Residential Policy Counts Since 2009 by ZIP-Level Fire Risk
Note: Sample includes homeowner, mobile home, and dwelling-fire policies in the admitted market. Policies for renters and condominium unit owners are excluded. Measure of wildfire risk is based on the average fire risk scores at the ZIP code level from CDI’s Wildfire Risk Report, measured as of the 2018 estimates.
Source: Data on ZIP code-level admitted market policy counts (based on earned exposure) from the California Department of Insurance’s (CDI) Community Service Statement Dataset. ZIP code-level fire risk from CDI’s Wildfire Risk Information Report.
Growing Reliance on the State’s FAIR Plan
This decline in admitted market coverage led many property owners to have to turn to the state’s FAIR Plan (see box). Over this period, there is thus a commensurate increase in policyholders in the high fire-risk areas of the state enrolling in the FAIR Plan. As is seen in Figure 3, growth in the FAIR Plan was dramatic following the 2017 and 2018 fire seasons in the highest wildfire risk areas, but actually declined somewhat in the lowest-risk areas of the state. (For a breakdown of FAIR Plan policies and market share by zip code with interactive maps and charts, see our companion post.) This has led the portfolio of the FAIR Plan to become increasingly dominated by wildfire risk, not the peril for which it was created.
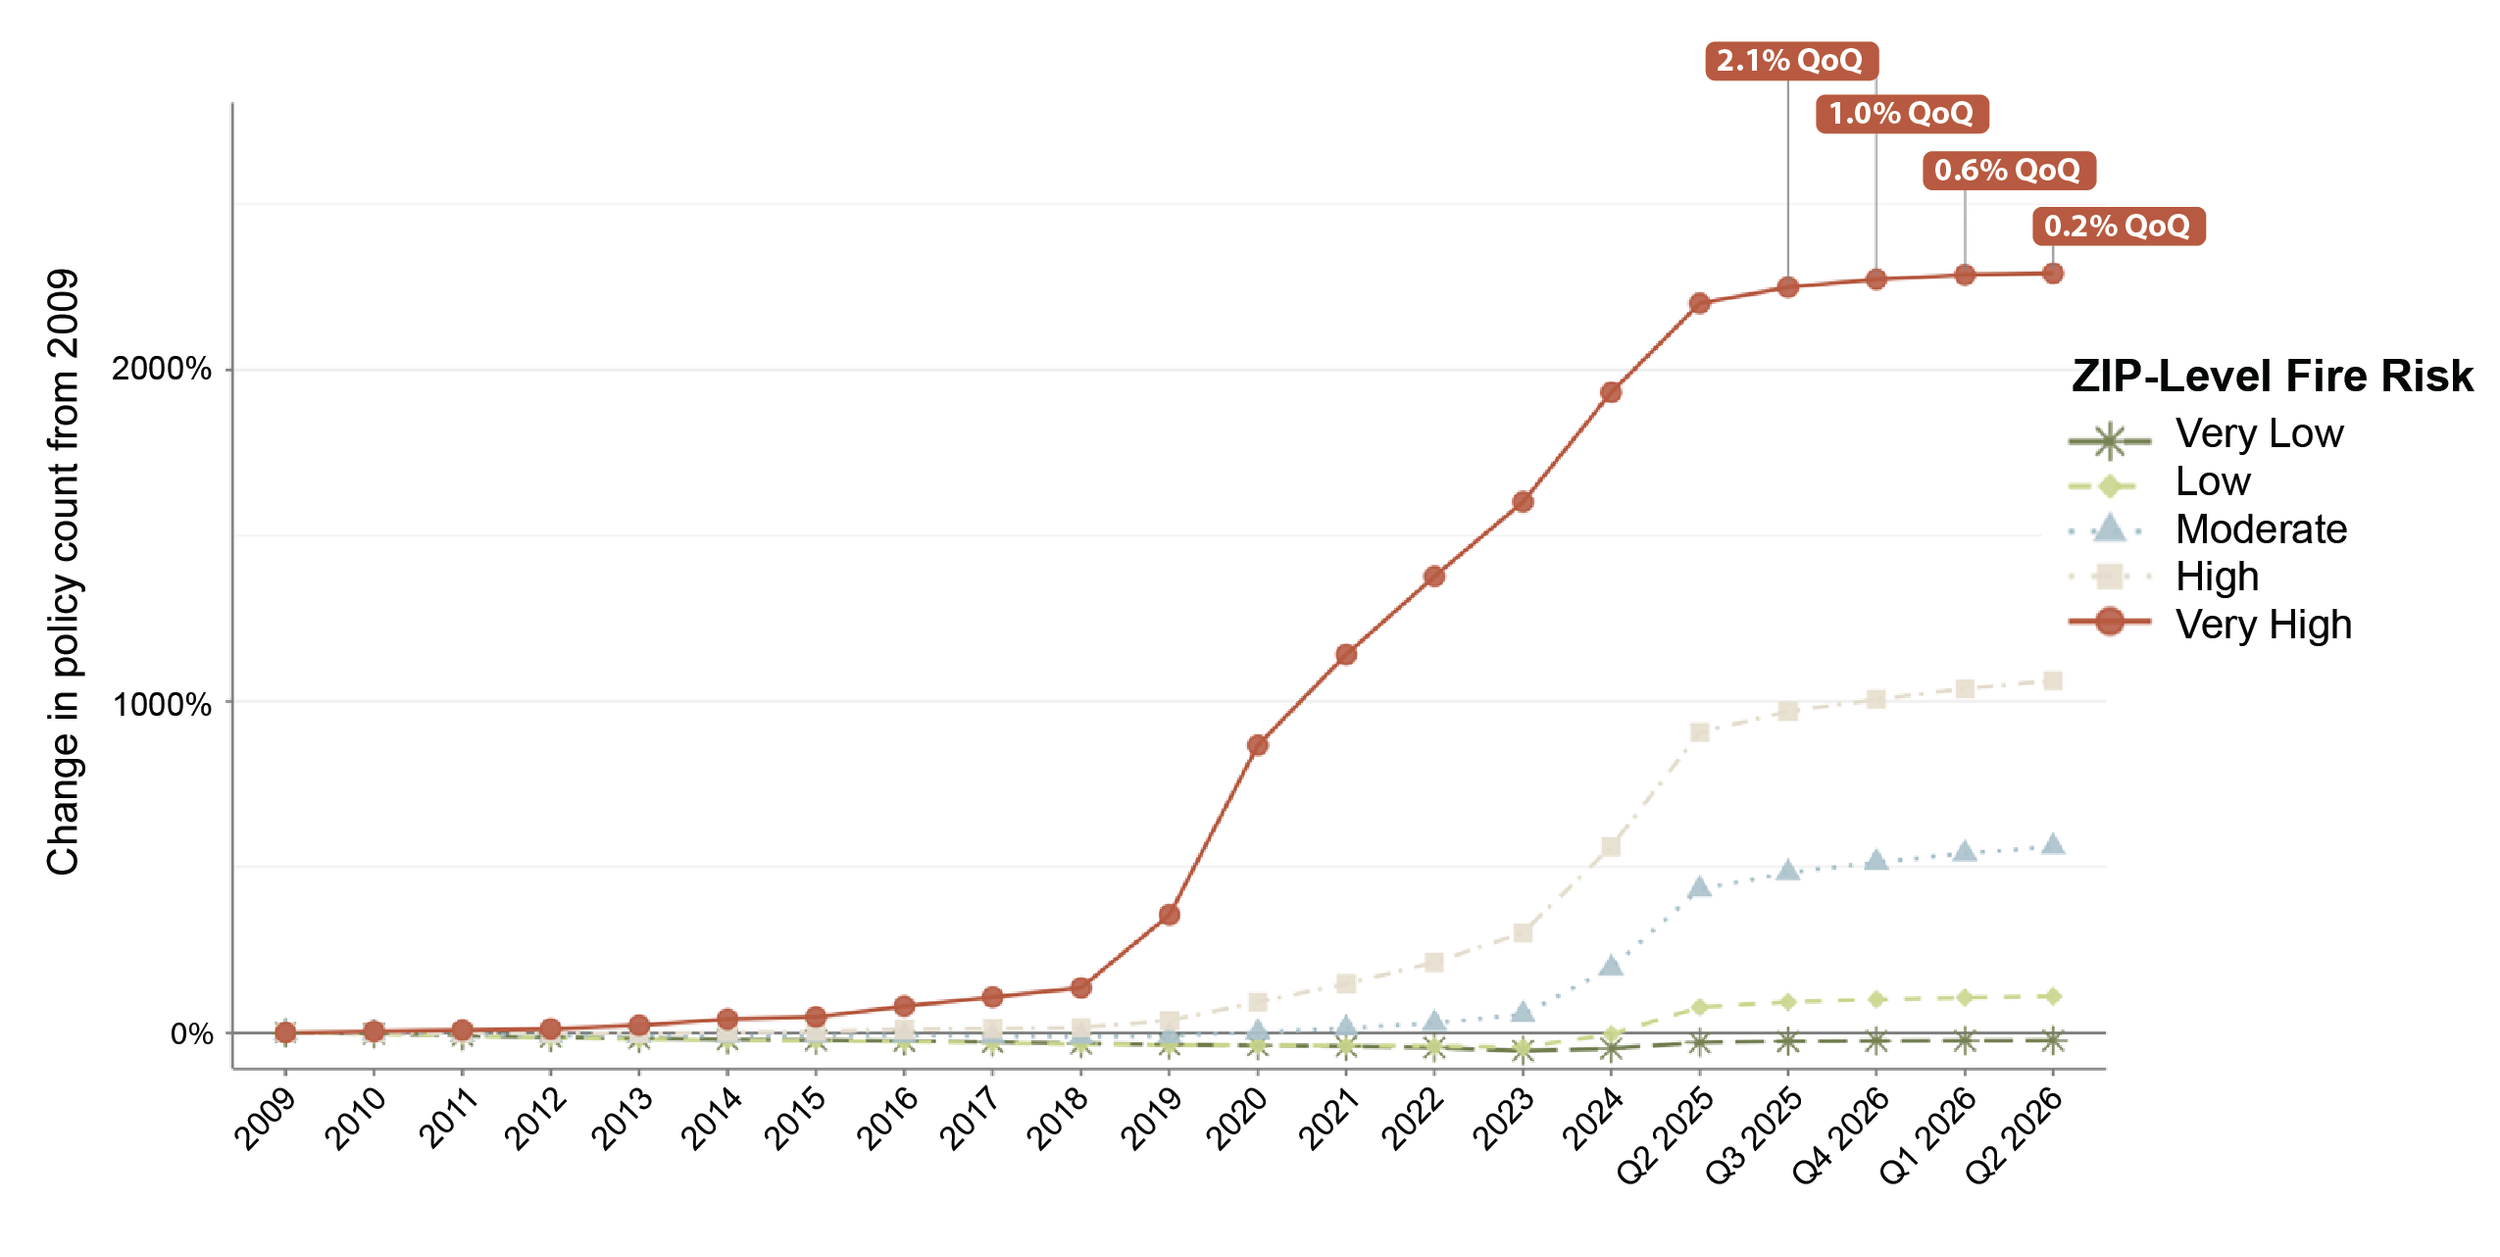
Figure 3: Change in FAIR Plan Policy Counts Since 2009 by ZIP-Level Fire Risk
Note: QoQ = quarter-over-quarter growth rate. Policies for renters and condominium unit owners are excluded. Measure of wildfire risk is based on the average fire risk scores at the ZIP code level from CDI’s Wildfire Risk Report, measured as of the 2018 estimates.
Source: Yearly FAIR Plan data over 2009 to 2024 from the California Department of Insurance’s (CDI) Community Service Statement Dataset. Quarter data over Q2 2025 to Q2 2026 from California FAIR Plan Key Statistics & Data. ZIP code-level fire risk from CDI’s Wildfire Risk Information Report.
What is the FAIR Plan?
Fair Access to Insurance Requirements (FAIR) plans were originally created in 1968 to provide access to basic property insurance in urban centers where private insurers had withdrawn due to concern over civil disruption, as well as a history of redlining. The CA FAIR Plan is a non-voluntary association of all admitted insurers in the state sharing in both profits and losses in proportion to market share. It is not a state agency and does not rely on taxpayer funding. Its board is composed of members of private insurers operating in California. FAIR Plan policies only provide fire coverage, not the full suite of perils offered by standard homeowners insurance. See our residual markets page for more information on state-created markets of last resort.
Since growth in the FAIR Plan has been concentrated in the highest-risk areas of the state, the market share of the FAIR Plan varies dramatically by wildfire risk. Statewide, in 2024, the CA FAIR Plan was roughly 5% of the residential property market (estimated to exceed 6% in 2026 based on recent trends). But in the highest risk geographies, it far exceeds this, as shown in Figure 4. In the highest wildfire-risk zip codes, the market share can climb well past 40%, while it can be in the single digits or below 1% in lower-risk zip codes [5].
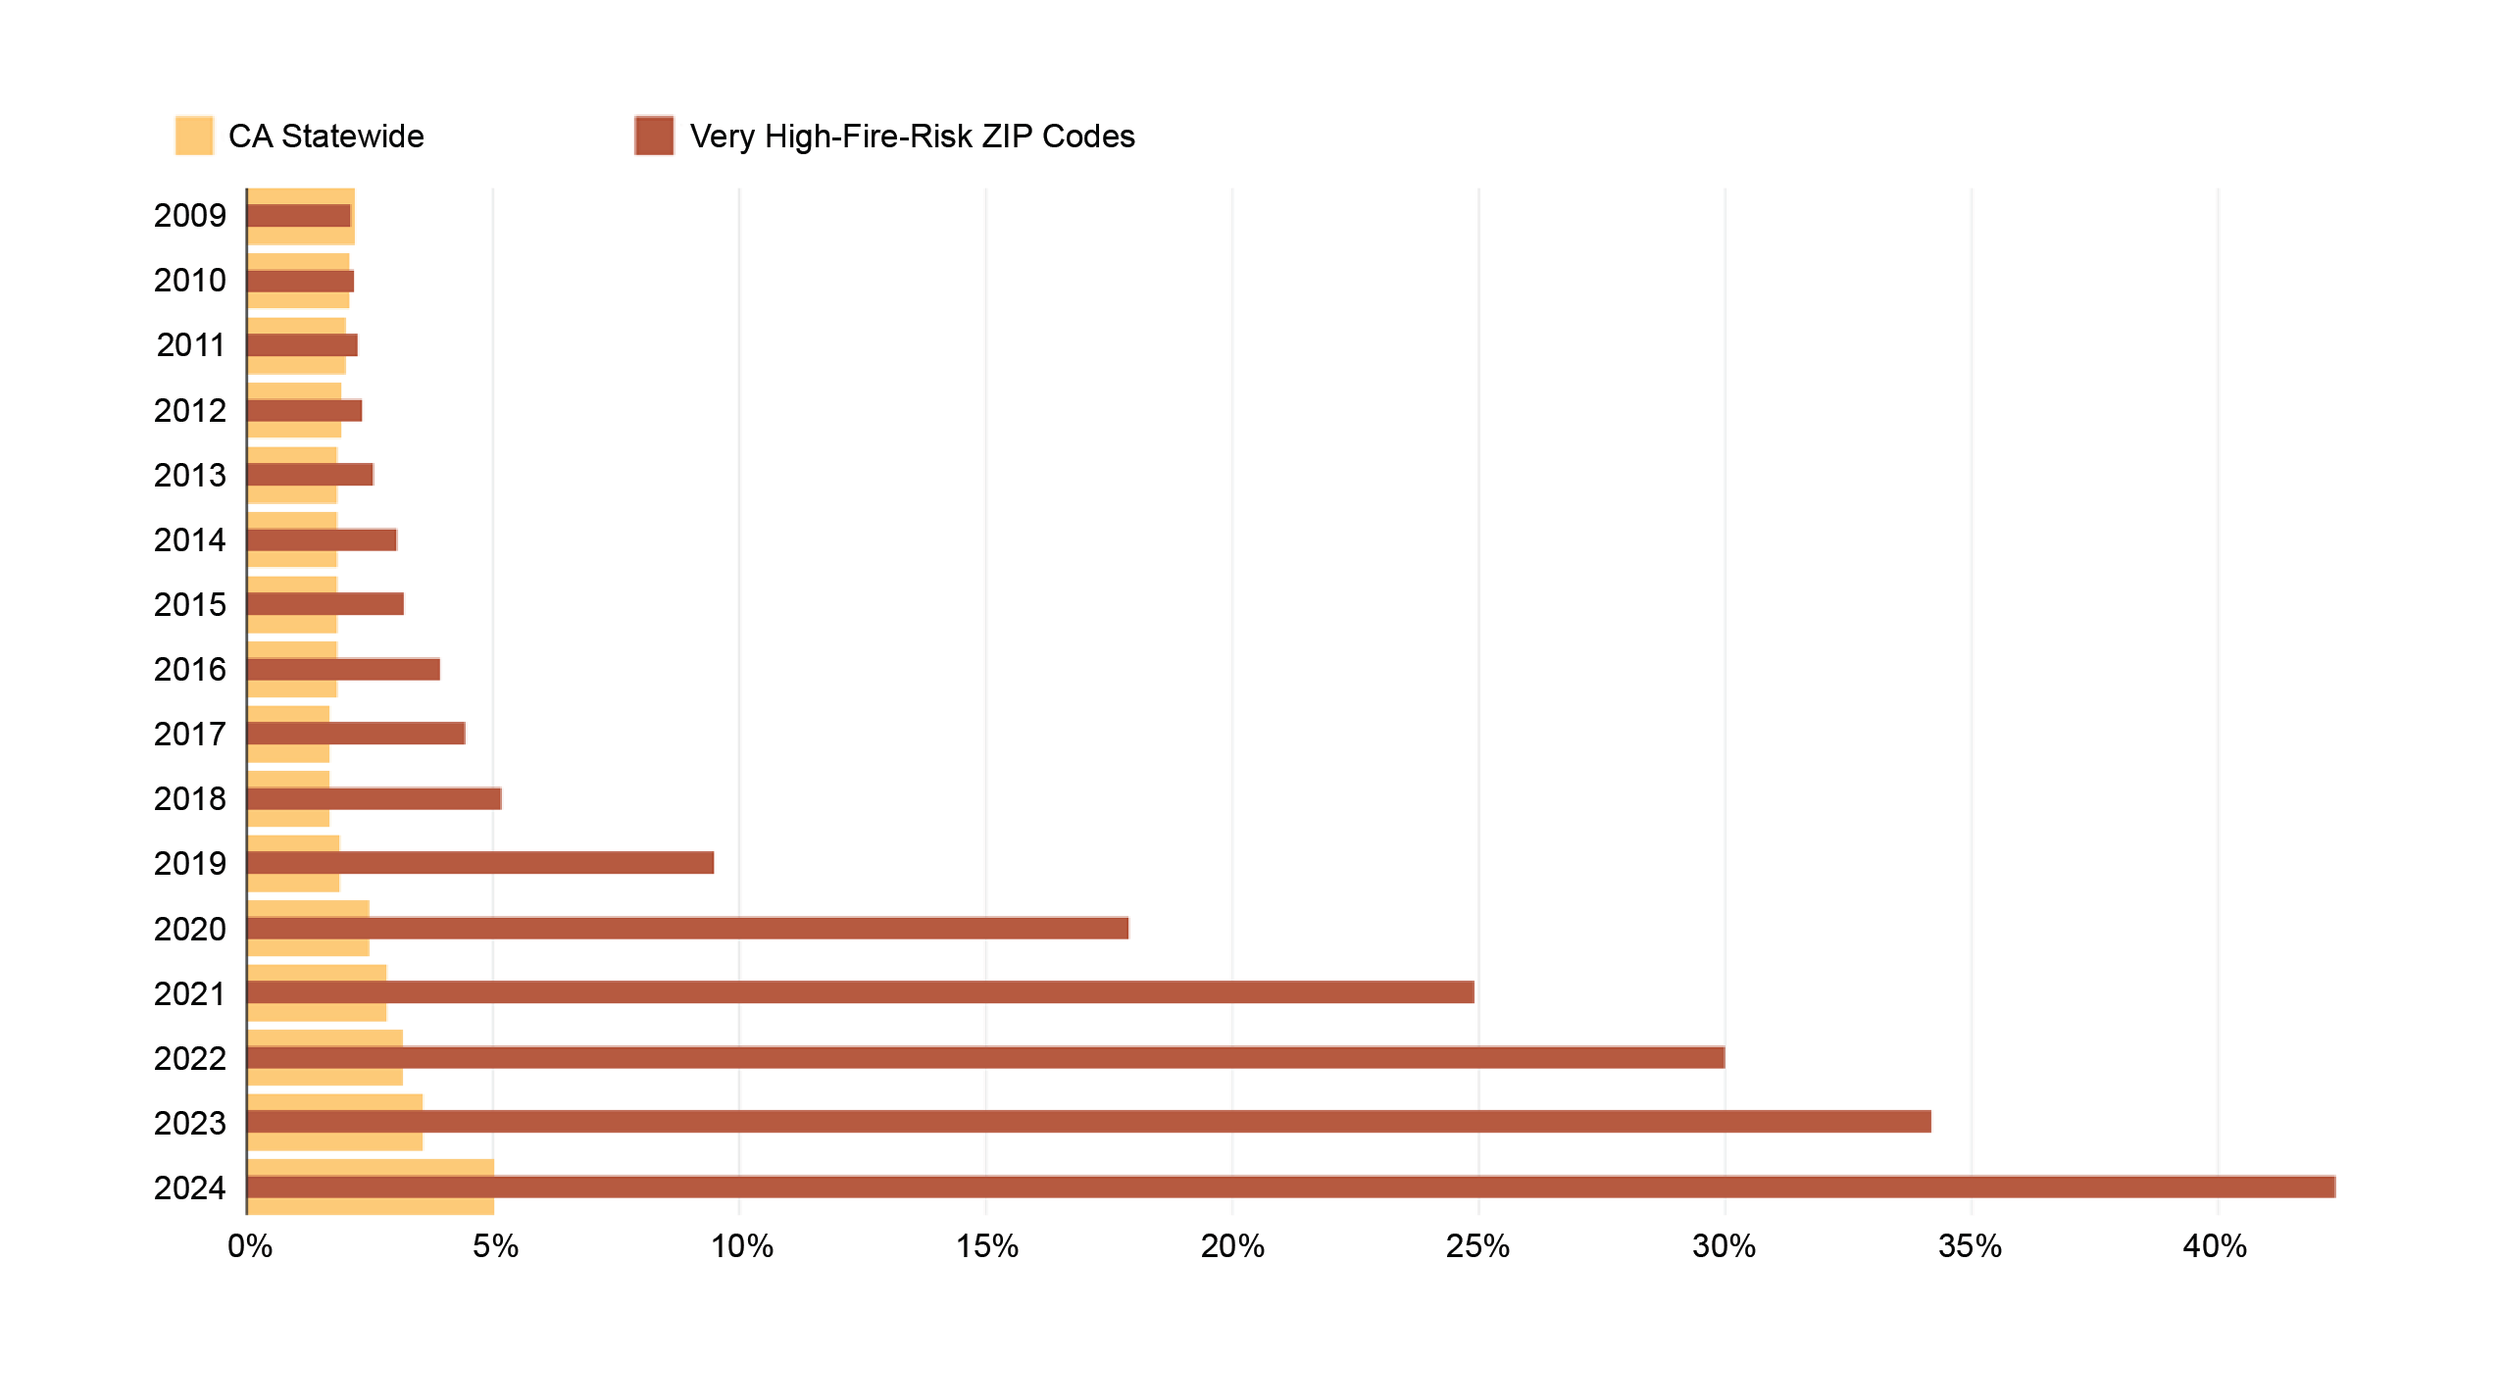
Figure 4: California FAIR Plan Market Share by Policy Count
Note: Policies for renters and condominium unit owners are excluded. CA FAIR Plan market share is calculated by dividing the number of FAIR Plan policies by the total count of homeowner, mobile home, dwelling fire (including FAIR Plan), and lender force-placed policies. Measure of wildfire risk is based on the average fire risk scores at the ZIP code level from CDI’s Wildfire Risk Report, measured as of the 2018 estimates.
Source: Data on ZIP code-level policy counts (based on earned exposure) from the California Department of Insurance’s (CDI) Community Service Statement Dataset. ZIP code-level fire risk from CDI’s Wildfire Risk Information Report.
Divergence in Market Concentration
The markets also look different across other metrics of market health, such as concentration, a measure of competition. Increased competition is good for consumers as it usually comes with lower prices and more options. As can been seen in Figure 5, in lower-risk areas of the state, market concentration has generally trended downward since 2009, indicating growing competitiveness. However, in stark contrast, market concentration in very high-risk zip codes has been rising dramatically since 2020.
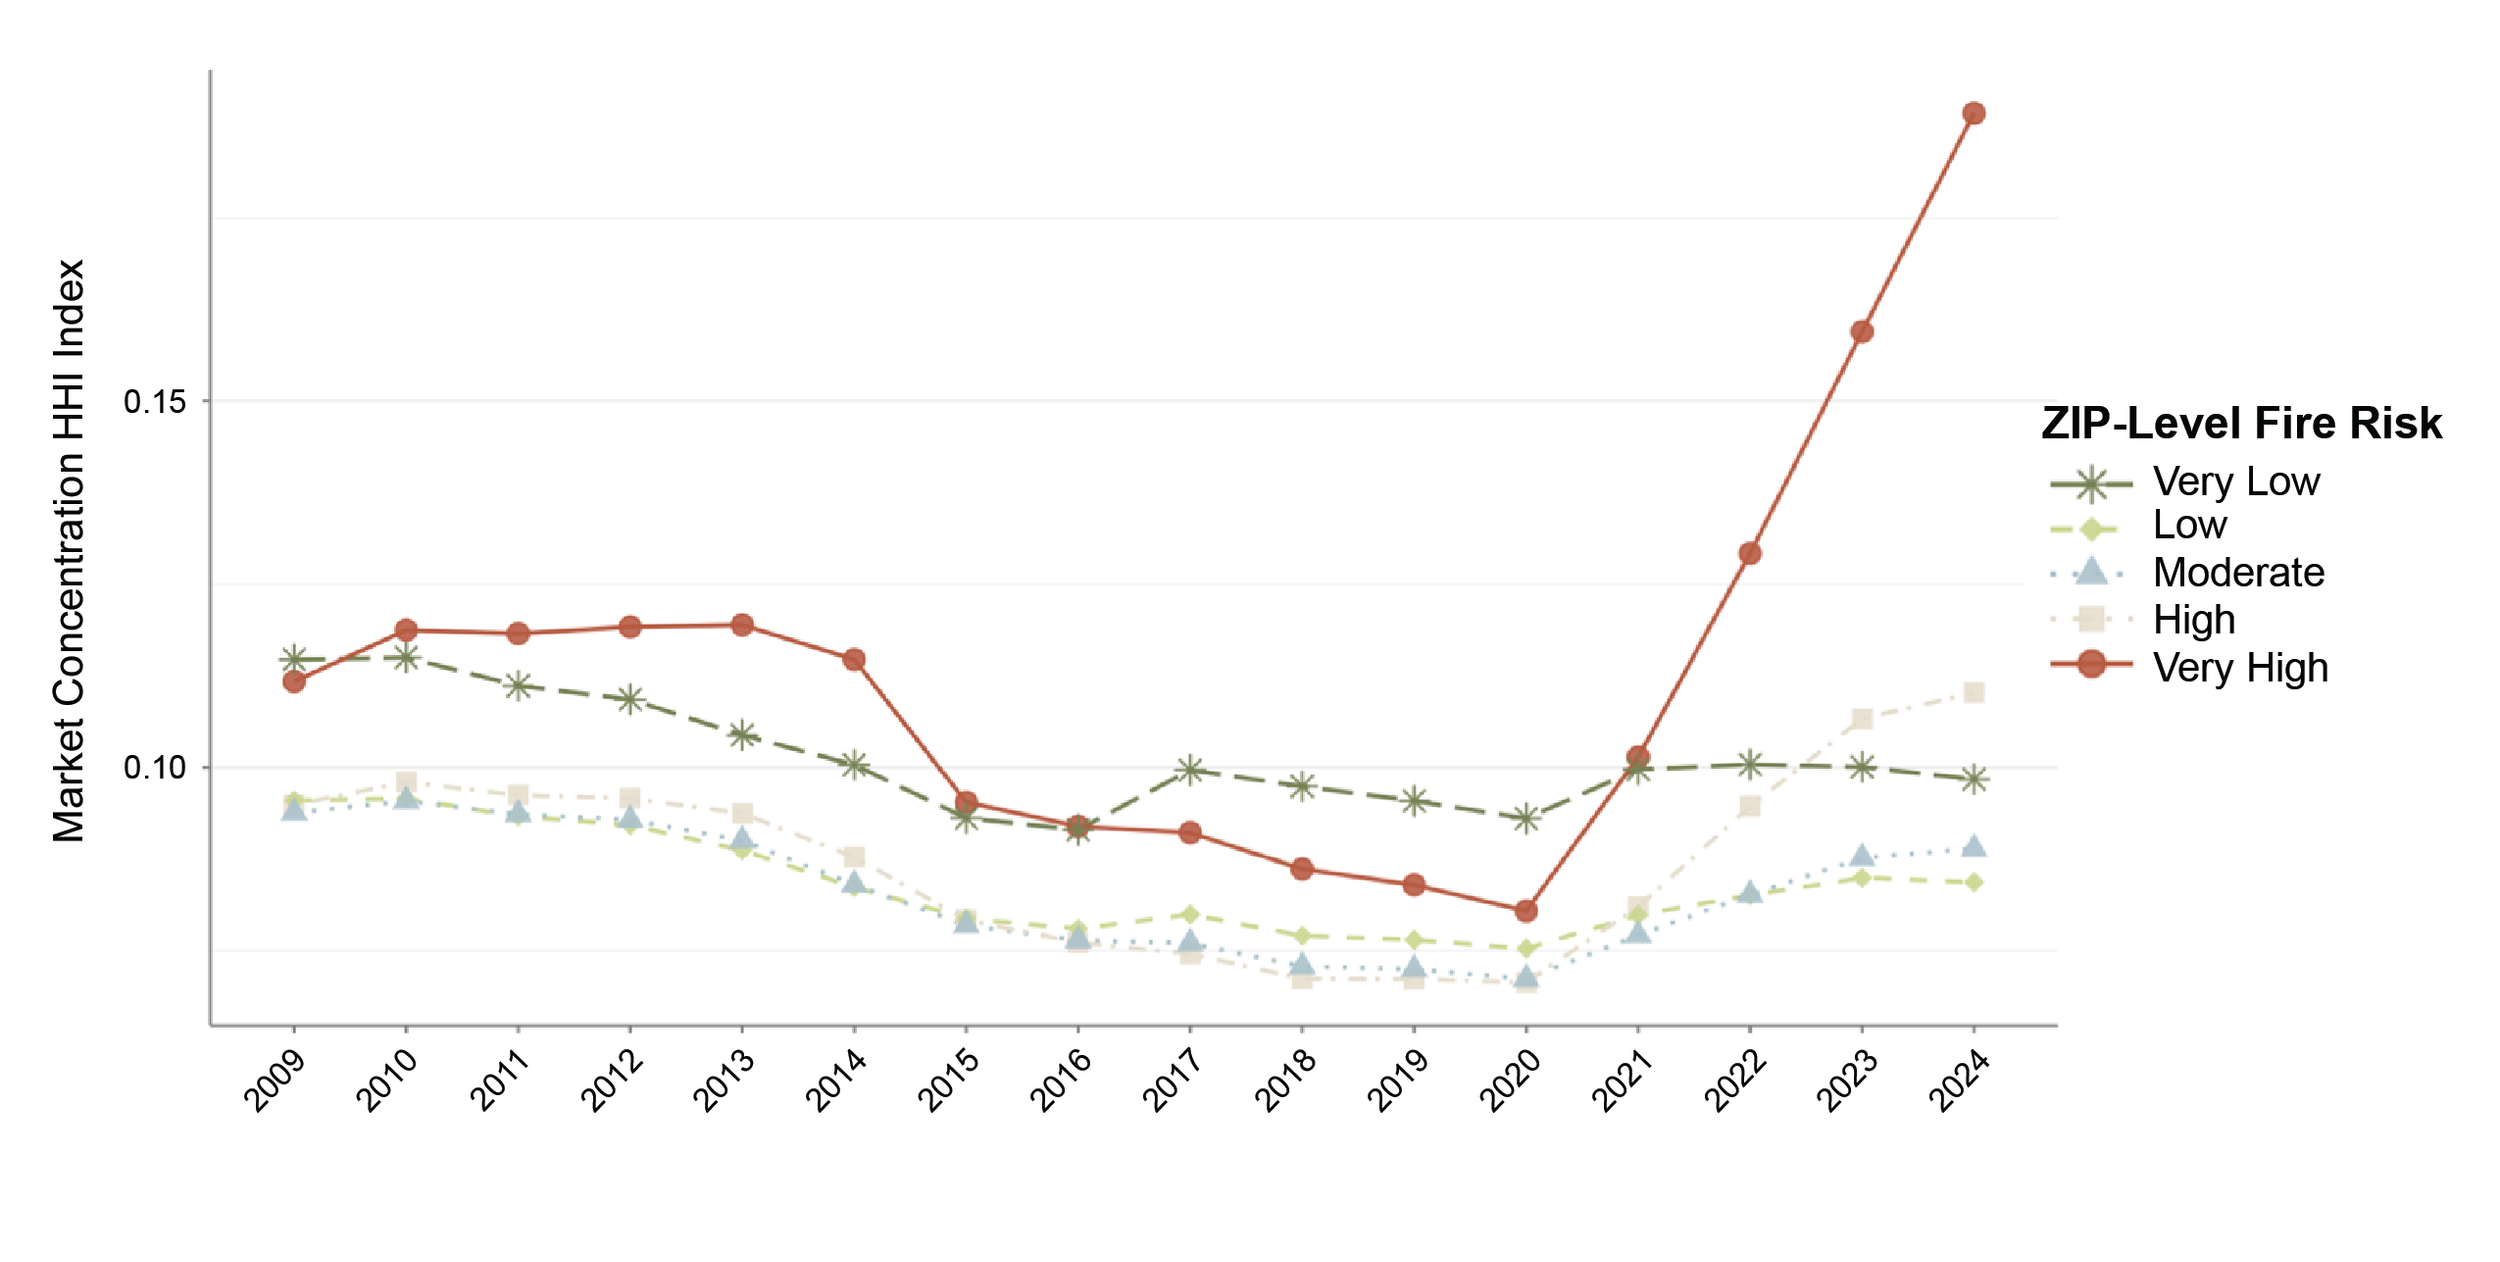
Figure 5: Market Concentration in Admitted Market by ZIP-Level Fire Risk
Note: Market concentration is measured using the Herfindahl-Hirschman Index (HHI), calculated as the sum of the squares of each admitted insurer’s market share based on earned premiums. Higher values indicate that a smaller number of insurers account for a larger share of the market, while lower values indicate a more competitive market with many insurers. An increase in the HHI indicates that market share is becoming more concentrated among fewer insurers, while a decrease suggests that the market is becoming more competitive. Policies include homeowner, mobile home, and dwelling-fire policies. Policies for renters and condominium unit owners are excluded. Admitted market only.
Source: Data on insurer ZIP code-level exposures from the California Department of Insurance’s (CDI) Community Service Statement Dataset. ZIP code-level fire risk from CDI’s Wildfire Risk Information Report.
Risk and Regulation
The sharp contrast of market conditions in the highest-risk areas of the state regarding coverage availability, FAIR Plan reliance, and market competition suggest that there is not one market story for California, but a tale of two markets, varying by wildfire risk. This has led some to observe that the state may not have an insurance problem so much as a risk problem.
While there is much truth in this statement – wildfire risk is a differentiator of insurance market outcomes – it is not the complete picture. Market conditions have been a function not just of this growing risk, but how that growing risk has interacted with the regulatory environment in the state.
Historically, regulations in California prohibited insurers from using catastrophe models (with the exception of earthquake and fire following earthquake) and from incorporating reinsurance costs in insurance rate setting (with the exception of earthquake and specific medical malpractice coverage). These are both essential tools to writing insurance for disasters where risks are correlated and losses can be severe (see our explainer on risk pooling and diversification.) For risks that can be rare but catastrophic, or that are changing over time, historical data is inadequate and insurers need access to more sophisticated modeling to underwrite and price policies. Additionally, risks in which entire neighborhoods can be devastated at once require the diversification provided by global reinsurance. The inability to use these tools in California was, until recently, a serious handicap to providing insurance coverage for a growing wildfire risk in the state.
Beginning in 2023, however, Commissioner Lara and the California Department of Insurance (CDI) put forward several regulatory reforms aimed at stabilizing property insurance. These reforms are bundled under an initiative called the Sustainable Insurance Strategy (SIS). Under the SIS, insurers can now use both wildfire catastrophe models and include the net costs of reinsurance in rates. When using these risk assessment tools, insurers must also, however, commit to write and maintain policies at a level at least 85% of their statewide market share in wildfire-distressed areas, with a requirement to increase this share by 5% every two years until the target is met, an attempt to bring coverage back to areas from which admitted insurers have been retreating. This has been coupled with reforms to speed rate approvals and modify the intervenor process to make it easier for insurers to adjust in an environment of growing risk.
Early signs are that the SIS is improving the market. The last three quarters have seen FAIR Plan growth steadily decline: in the very-high-risk areas, for example, the quarter-over-quarter growth rates have decreased from 2.1% in Q3 2025 to 1.0% in Q4 2025, 0.6% in Q1 2026, and now down to 0.2% in Q2 2026 (see Figure 3). In addition, there have been announcements from large firms about expansion in the state. In April 2026, for example, Travelers announced it would expand homeowners insurance offerings in California and stated in a news release it was due to the SIS. And in May 2026, the SIS filing for Farmers was approved and the firm noted they have already seen a 10% increase in new business in distressed areas. This is in addition to eight other SIS filings that have now been approved.
The Need for Greater Loss Reduction
As seen in the tale of two markets discussed here, it is not the entire state of California that is in market crisis, but only the highest wildfire-risk areas. The insurability challenges that have stressed these areas are due to a combination of both growing catastrophic risk and a regulatory environment that was not built to manage such a growing risk. Recent reforms have begun to improve the regulatory environment. They now need to be coupled to a large-scale and sustained commitment to loss reduction, that is, reducing the underlying risk itself to improve market insurability.
While loss reduction is a statewide challenge, the analysis here suggests one piece of this commitment should be focused specifically on the highest wildfire-risk zip codes that have experienced the greatest market dislocation. Measures could include home hardening and defensible space programs for existing structures, stricter building codes for construction in high-risk areas, and targeted community-scale fuel reduction. The benefit is not just fewer losses in the next major fire season, but a market where insurers are more willing and better able to offer coverage at more affordable prices in the areas that need it most. Of course, ensuring that such loss reduction measures translate into improved insurance market outcomes also requires improvements in data and verification, processes to incorporate mitigation information in underwriting, and wildfire modelers finding approaches for timely updating with localized loss reduction information.
Endnotes
[1] Calculation based on residential structure data from the National Structure Inventory and insured catastrophic fire losses from CDI’s Wildfire Risk Information Report.
[2] Calculation based on California Department of Insurance’s 2025 Residential and Earthquake Insurance Coverage Study, projected to 2026 using recent updates from California FAIR Plan Key Statistics & Data.
[3] Insurer-level financial statement data from the National Association of Insurance Commissioners (NAIC).
[4] Calculation based on ZIP code-level data from the California Department of Insurance’s (CDI) Community Service Statement Dataset.
[5] Calculation based on ZIP code-level data from the California Department of Insurance’s (CDI) Community Service Statement Dataset.